

Your React Native Bug May Be Native: Put iOS and Android Logs in Context
Some React Native bugs look like JavaScript failures right up until the JavaScript logs stop being useful.
A screen opens and immediately closes. A native module rejects an operation without preserving the reason. A permission dialog behaves differently on one platform. An image request fails below the JavaScript networking layer. The app process restarts before the console can tell the rest of the story.
At that point, I usually open another tool. I run adb logcat for Android or open the Xcode console
for iOS, reproduce the problem again, and try to align those messages with Metro, network activity,
navigation, and application state. Each tool is valuable, but the investigation becomes a manual
timestamp-matching exercise.
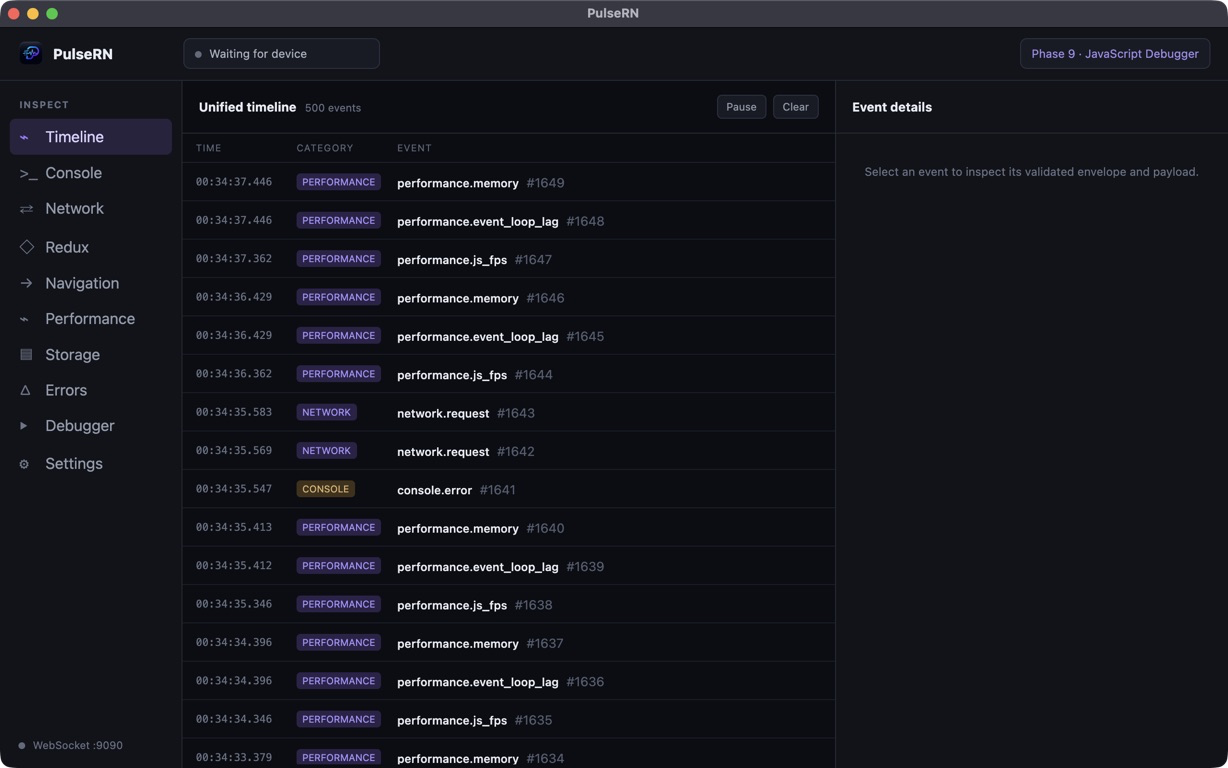
That is why I added native log capture to PulseRN. The goal is not to replace the platform tools. It is to keep the native part of a React Native failure beside the JavaScript events that caused it.
The boundary is where the useful context disappears
Section titled “The boundary is where the useful context disappears”React Native applications cross the JavaScript/native boundary constantly. A user action may begin in a React component, dispatch a Redux action, navigate to another screen, call a library, and end inside an iOS framework or Android service.
When each layer is inspected separately, I can see fragments:
- the JavaScript console shows the action I logged;
- the network inspector shows a request or its absence;
- Redux shows the state transition;
- Android or iOS emits the platform-specific warning;
- an error boundary shows what the application finally rendered.
The hard question is not whether any one fragment exists. It is which event led to the next one.
Imagine an upload flow. The user selects a file, the app navigates to a progress screen, Redux marks the upload as active, and a native file API reports that its URI cannot be opened. In separate tabs, the native message looks like an isolated file-system problem. In sequence, it becomes clear that the wrong URI was passed immediately after the selection action.
Chronology does not prove causation, but it gives me a much better hypothesis than five disconnected views.
Capture the application process, not the whole device
Section titled “Capture the application process, not the whole device”Raw device logs are noisy. An emulator is running the operating system, launchers, background services, development helpers, and sometimes several applications. Capturing all of it makes search harder and increases the chance of retaining unrelated data.
PulseRN instead associates the connected SDK client with the native application identifier and then resolves that application’s process. On Android, it runs a process-scoped logcat stream. On iOS, it starts a Simulator log stream filtered to the resolved process identifier.
The underlying commands are equivalent to:
adb -s <emulator-serial> logcat -v threadtime --pid=<app-pid>xcrun simctl spawn <simulator-udid> log stream --style json --level debug \ --predicate 'processIdentifier == <app-pid>'This is deliberately a narrow integration. PulseRN uses the platform command-line tools already provided by Android SDK Platform-Tools and Xcode. It does not install a native logging library into the application, and it does not pretend that every line emitted by the operating system belongs to the app.
Process filtering is not a privacy guarantee. Application logs can still contain tokens, personal data, or request content if the application or one of its dependencies writes them. Developers still need sensible logging practices and should inspect captured data before exporting a session.
Give the debugger enough identity
Section titled “Give the debugger enough identity”The SDK configuration needs the same application ID that the platform uses. It also needs the platform name so PulseRN knows which capture path to use.
import { Platform } from "react-native";import { ReactNativeDevTool } from "@pulse-rn/sdk";
if (__DEV__) {  ReactNativeDevTool.configure({    host: Platform.OS === "android" ? "10.0.2.2" : "127.0.0.1",    port: 9090,    appName: "MyApp",    appId: "com.example.myapp",    device: {      platform: Platform.OS,    },  }).connect();}
For Android, appId must match the application ID of the installed development build. For iOS, it
must match the bundle identifier. A display name is not enough because the debugger uses this value
to find the running process.
When exactly one Android Emulator or iOS Simulator is booted, PulseRN can select it automatically.
When several are running, I set device.nativeTargetId explicitly:
device: { platform: Platform.OS, nativeTargetId: Platform.OS === "android" ? "emulator-5554" : "A1B2C3D4-EXAMPLE-SIMULATOR-UDID",},Android target IDs come from adb devices. Booted iOS Simulator identifiers come from
xcrun simctl list devices booted.
This configuration should remain inside __DEV__. PulseRN is a development debugger, and the SDK
initialization should not be bundled into a production path.
Read a failure as one sequence
Section titled “Read a failure as one sequence”Once the SDK connects, PulseRN starts native capture and puts those records into the same session as the other application signals. I can then investigate a failure as a sequence instead of repeatedly reproducing it for different tools.
A practical workflow looks like this:
- Clear the visible projection or add a bookmark before reproducing the problem.
- Perform one narrowly defined action in the app.
- Find the first unexpected result—an error, failed request, route change, or native warning.
- Move backward in time to the user action and state changes that preceded it.
- Filter native messages by level or source, then search for the library, subsystem, tag, process, or error text involved.
- Inspect the events immediately after the native message to see how JavaScript handled the failure.
Android tags are retained as source information. On iOS, subsystem and category are retained when the log stream supplies them. Native levels are normalized into verbose, debug, info, warning, error, and fatal categories so I can reduce noise without losing the original message identity.
The Native Logs view can be paused while I inspect a burst of output. Clearing that view only clears the current projection; it does not silently delete the retained session. That distinction matters when I want a clean screen during reproduction but still need to return to earlier evidence.
Restarts should not end the investigation
Section titled “Restarts should not end the investigation”Some of the most important native failures terminate or restart the application process. A capture system that binds permanently to one process ID would stop at exactly the wrong moment.
PulseRN treats the application identity as stable and the process ID as temporary. If the process disappears while the SDK connection is active, the native-log status moves to a waiting state. The desktop or browser host checks for the application again and attaches to its new process when it returns.
The UI exposes whether capture is starting, active, waiting, or in an error state. This avoids a dangerous debugging assumption: an empty native-log view might mean “nothing happened,” or it might mean the platform tools, target, identifier, or process could not be resolved.
Bounded capture is part of correctness
Section titled “Bounded capture is part of correctness”Native logs can arrive much faster than a human can read them. A runaway loop or verbose dependency should not be allowed to consume memory and storage without limit.
PulseRN currently bounds individual native messages at 100,000 characters and limits ingestion to 12,000 native events per minute. Oversized messages are truncated, and rate-limited events are counted as dropped. Capture status exposes the dropped count rather than presenting an incomplete timeline as complete.
These limits are not merely performance optimizations. They make the evidence honest. If the debugger discarded part of a burst, that loss can affect an investigation and needs to be visible.
Native events are persisted with the rest of the session in local SQLite storage. They survive a UI reload, can be included in session archives, and can be queried through PulseRN’s local MCP tools. The same retention and export cautions that apply to console, network, and Redux data also apply to native messages.
What this feature does not support yet
Section titled “What this feature does not support yet”The current native-log capture is intentionally limited to Android Emulator and iOS Simulator. It does not capture native logs from physical devices. Physical devices can still connect to the PulseRN SDK for supported JavaScript telemetry, but native capture is a separate capability.
The workflow also requires:
- React Native 0.76 or newer in a development build;
- Android SDK Platform-Tools with
adbavailable for Android capture; - Xcode command-line tools with
xcrunavailable for iOS capture; - an exact Android application ID or iOS bundle identifier;
- a target ID when more than one matching virtual device is running.
Expo Go is not a supported target for this native-log workflow. Use an Expo development build or a React Native Community CLI development build whose application identifier you control.
PulseRN also does not replace Xcode or Android Studio. I still use those tools for platform breakpoints, crash reports, view debugging, profiling, and the complete unfiltered device log. The value here is correlation: PulseRN makes the relevant application-process messages part of the same story as the React Native application.
The native layer belongs in the timeline
Section titled “The native layer belongs in the timeline”React Native debugging is easiest when the framework boundary is not also an evidence boundary. JavaScript explains user intent and application state. Native logs often explain what the platform actually did. Seeing both in order turns a vague cross-layer failure into a sequence I can test.
If you want to try the workflow, install the PulseRN SDK, follow the current quick-start guide, and run PulseRN as a desktop application or locally in a browser. The source and issue tracker are available in the PulseRN repository.